Examples
Some examples of what is possible. Please refer to the rest of the documentation for more examples.
Training and tuning an LS-SVM
import kerch

tr_set, _, _, _ = kerch.dataset.factory("two_moons",   # which dataset
                                     tr_size=250)      # training size
mdl = kerch.model.LSSVM(type="rbf",                    # kernel type
                     representation="dual")            # initiate model
mdl.set_data_prop(data=tr_set[0],                      # data
                  labels=tr_set[1],                    # corresponding labels
                  proportions=[1, 0, 0])               # initiate dataset
mdl.hyperopt({"gamma", "sigma"},                       # define which parameters to tune
             max_evals=500,                            # define how many trials
             k=10)                                     # 10-fold cross-validation
mdl.fit()                                              # fit the optimal parameters found
kerch.plot.plot_model(mdl)                             # plot the model using the built-in method
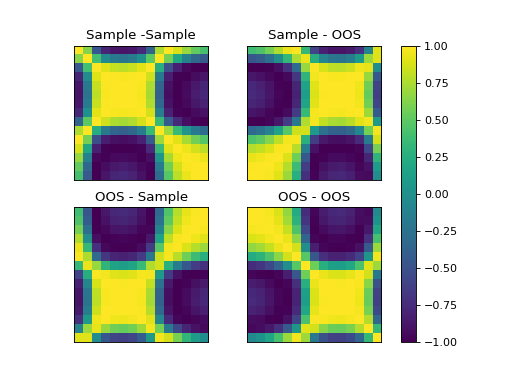
Out-of-sample normalized and centered kernels
import kerch
import numpy as np
from matplotlib import pyplot as plt

sample = np.sin(np.arange(0,15) / np.pi) + .1
oos = np.sin(np.arange(15,30) / np.pi) + .1

k = kerch.kernel.factory(type="polynomial", sample=sample, center=True, normalize=True)

fig, axs = plt.subplots(2,2)

axs[0,0].imshow(k.K, vmin=-1, vmax=1)
axs[0,0].set_title("Sample -Sample")

axs[0,1].imshow(k.k(y=oos), vmin=-1, vmax=1)
axs[0,1].set_title("Sample - OOS")

axs[1,0].imshow(k.k(x=oos), vmin=-1, vmax=1)
axs[1,0].set_title("OOS - Sample")

im = axs[1,1].imshow(k.k(x=oos, y=oos), vmin=-1, vmax=1)
axs[1,1].set_title("OOS - OOS")

for ax in axs.flat:
    ax.set_xticks([])
    ax.set_yticks([])

fig.colorbar(im, ax=axs.ravel().tolist())
(Source code, png, hires.png, pdf)
